Choosing a time period
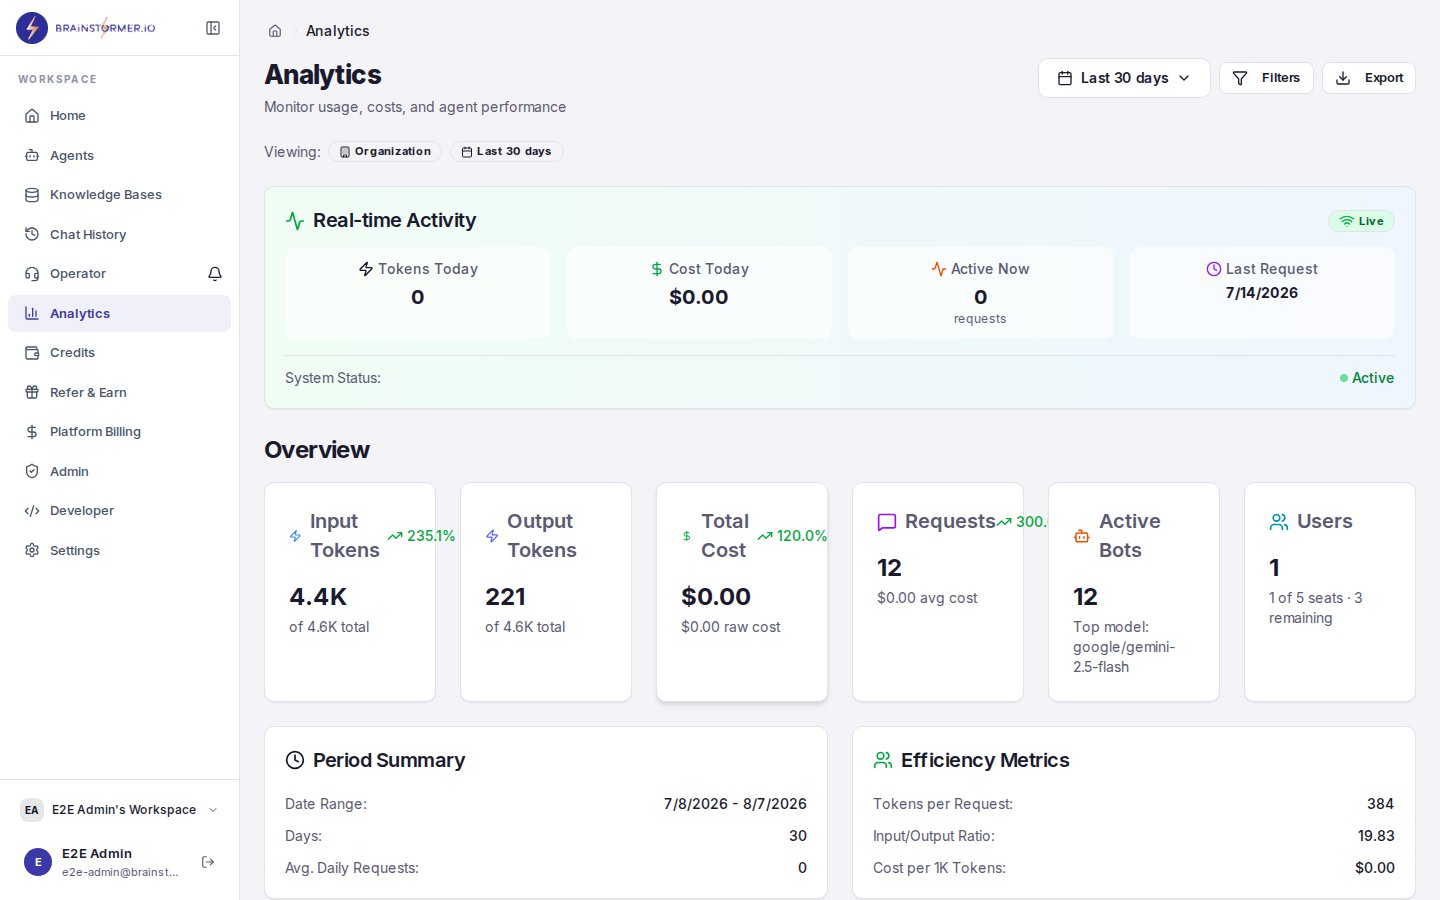
One control at the top of the page sets the time period for the whole dashboard — last 24 hours, 7 days, 30 days, or 90 days (30 days to begin with). Change it once and every panel follows, so you are never comparing a 7-day chart against a 30-day table. Individual panels no longer carry their own private date pickers. The panels are grouped into three tabs so you are not scrolling through eleven cards at once:- Usage — how much the knowledge base is being queried, by whom, and at what cost
- Content — which documents and chunks are actually being retrieved
- Outcomes — whether what was retrieved helped, and what it led to
Learning Progress is always all-time and says so on the card. It reports lifetime progress toward the learning unlocks, so narrowing the date range doesn’t — and shouldn’t — change it. Every other panel follows the period you pick.
Usage overview
The top of the dashboard summarizes retrieval activity over the period you selected:- Total queries — how often the knowledge base was searched
- Average response time — retrieval latency
- Top chunk retrievals — how many times the most-used chunks were pulled
- Average relevance — mean similarity of retrieved content
Outcome Attribution
This section answers the question “is my knowledge base actually helping?” by joining what was retrieved to what customers did next — thumbs, clicks, and conversions.-
Resource Performance — for each document: how often it was surfaced (impressions), thumbs up/down, a helpfulness rate, and a performance tier:
- Feedback-Driven Gaps — the questions your customers asked that earned a thumbs down, ranked by how often they failed. This is the most actionable list on the page: it tells you exactly what content to add or improve next.
- Engagement Funnel — impression → click → conversion on the resources your agents surface, with click-through and conversion rates. For commerce knowledge bases this shows whether retrieved products actually get clicked and bought.
Learning Progress
Retrieval improves on its own as your knowledge base is used. The Learning Progress card shows how much signal you’ve collected and what it unlocks.- Progress to the next unlock — a weighted score built from your customer signals. Not all signals count equally: a human correction outweighs a thumbs-up, which outweighs a click.
- What’s feeding the model — a breakdown by signal type (thumbs, clicks, conversions, human corrections). A Training mode row is reserved for a future feature where you answer or review questions directly — the strongest signal of all.
- Learning stages — three milestones that unlock as signal accrues:
- Smart ranking — resources your customers engage with are automatically boosted in retrieval.
- Learned weights — default content weights are replaced with ones learned from your customers.
- Custom reranker — a reranking model tuned on your business — something a competitor can’t copy.
Turning learning off
Smart ranking is on by default. If you’d rather keep full manual control over how content is ranked, use the Apply learning to ranking switch on the card to turn it off for that knowledge base. With it off, retrieval uses only semantic + keyword relevance and your content weights — no engagement boost.Learning is floor-gated per resource: a document must accumulate enough evidence before its engagement can move ranking, so a handful of early clicks never skews results. New knowledge bases show “Collecting signal” until enough usage accrues.