

How Credits Work
Every billable operation — a chat completion, an embedding, a vector operation, a stored file — is converted into credits through the platform’s active rate card. The rate card is what turns a provider’s raw cost into what your organization is actually charged, and it has three parts:- A credit has a fixed dollar value. This is a small, stable unit (not fifty cents) chosen so that typical usage is measured in meaningful whole numbers rather than fractions.
- Margin is applied per rule, not as one platform-wide multiplier. A chat completion and a knowledge-base ingestion job are priced by different rules on the same card — they are not marked up by the same factor, and neither figure is fixed forever. The rate card can be updated, and doing so changes what every subsequent operation costs.
- A per-conversation ceiling caps the worst case. Every rate-card rule
that can repeat many times within one conversation is subject to a cap
(
capPerSubjectinternally) — no single conversation can burn more than that ceiling’s worth of credits, however long it runs or how many tool calls it makes. This is the strongest thing we can say about predictability: your worst-case cost per conversation is bounded, even though the typical cost is much lower.
The rate card’s specific numbers — the credit value, each operation’s margin,
and the per-conversation cap — are managed by platform administrators and can
change. For the current published figures (typical cost per conversation, plan
allowances, and how Brainstormer compares to per-conversation pricing
elsewhere), see Plans &
Packaging. This page describes
the mechanism; that page carries the numbers, so it’s the one source that gets
updated when the card changes.
What Consumes Credits
Credits are consumed by various operations across the platform:Fixed-mode prompts (welcome messages, system prompts) do not consume credits
because they do not call an AI model. Only generated-mode prompts that trigger
an LLM call are billed.
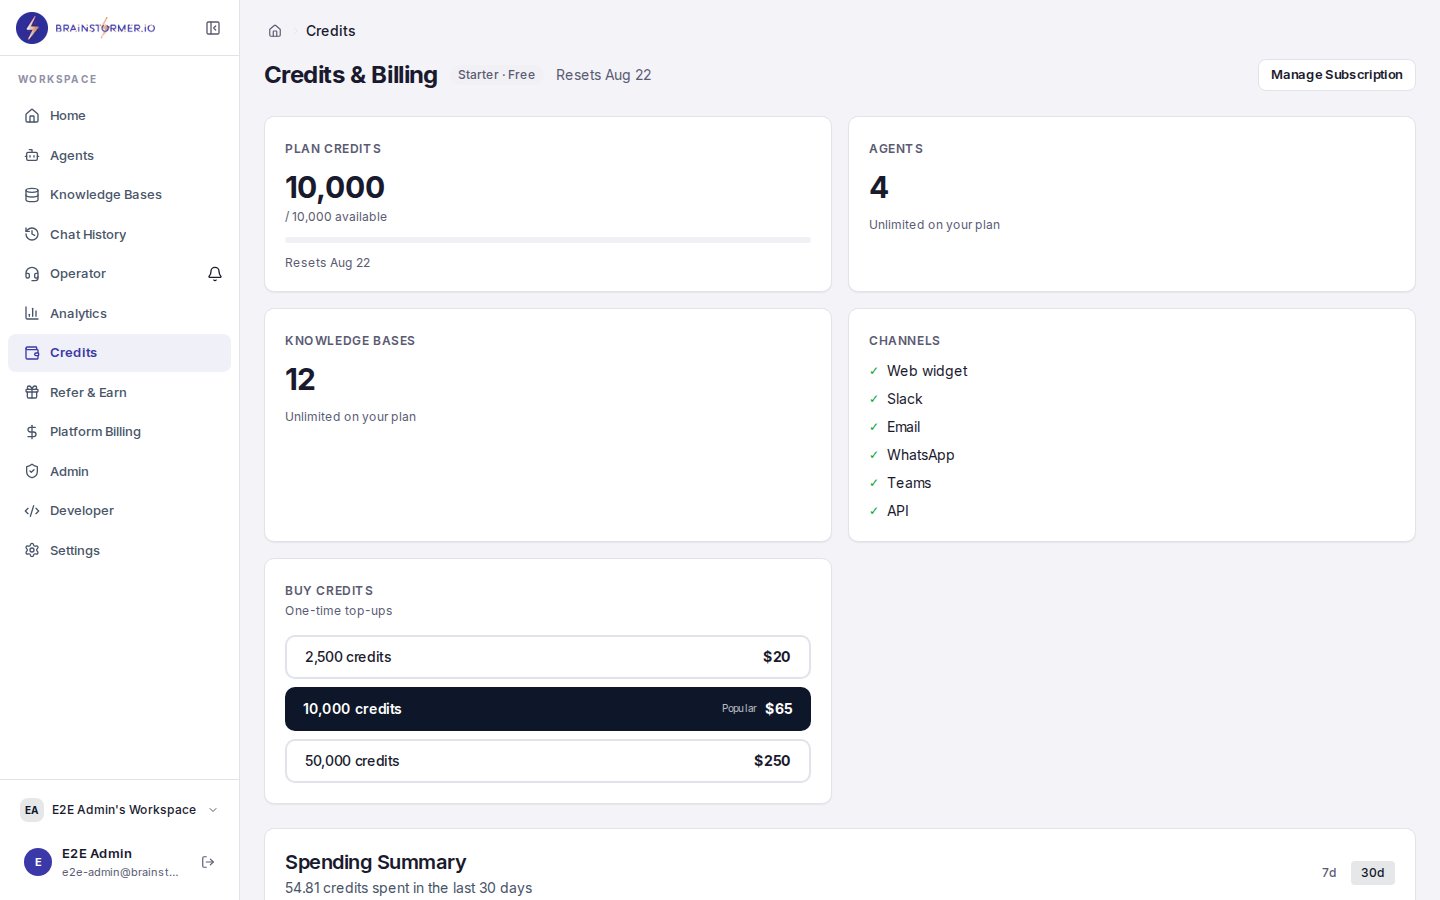
The credits and billing page showing your organization's credit balance
Credit Wallet
Each organization has a credit wallet with two pools that make up your available balance:- Plan credits — your plan’s recurring monthly allowance. These reset on your renewal date: for a paid subscription, that’s the date your Stripe subscription renews; for the free plan, it’s the 1st of each month. This date is calculated from your actual billing cycle, not an approximation.
- Add-on credits — credits from a top-up purchase, an admin grant, or a referral bonus. These never expire and carry over month to month.
Tracking Usage
Usage Dashboard
Navigate to Billing in the sidebar to see your organization’s usage: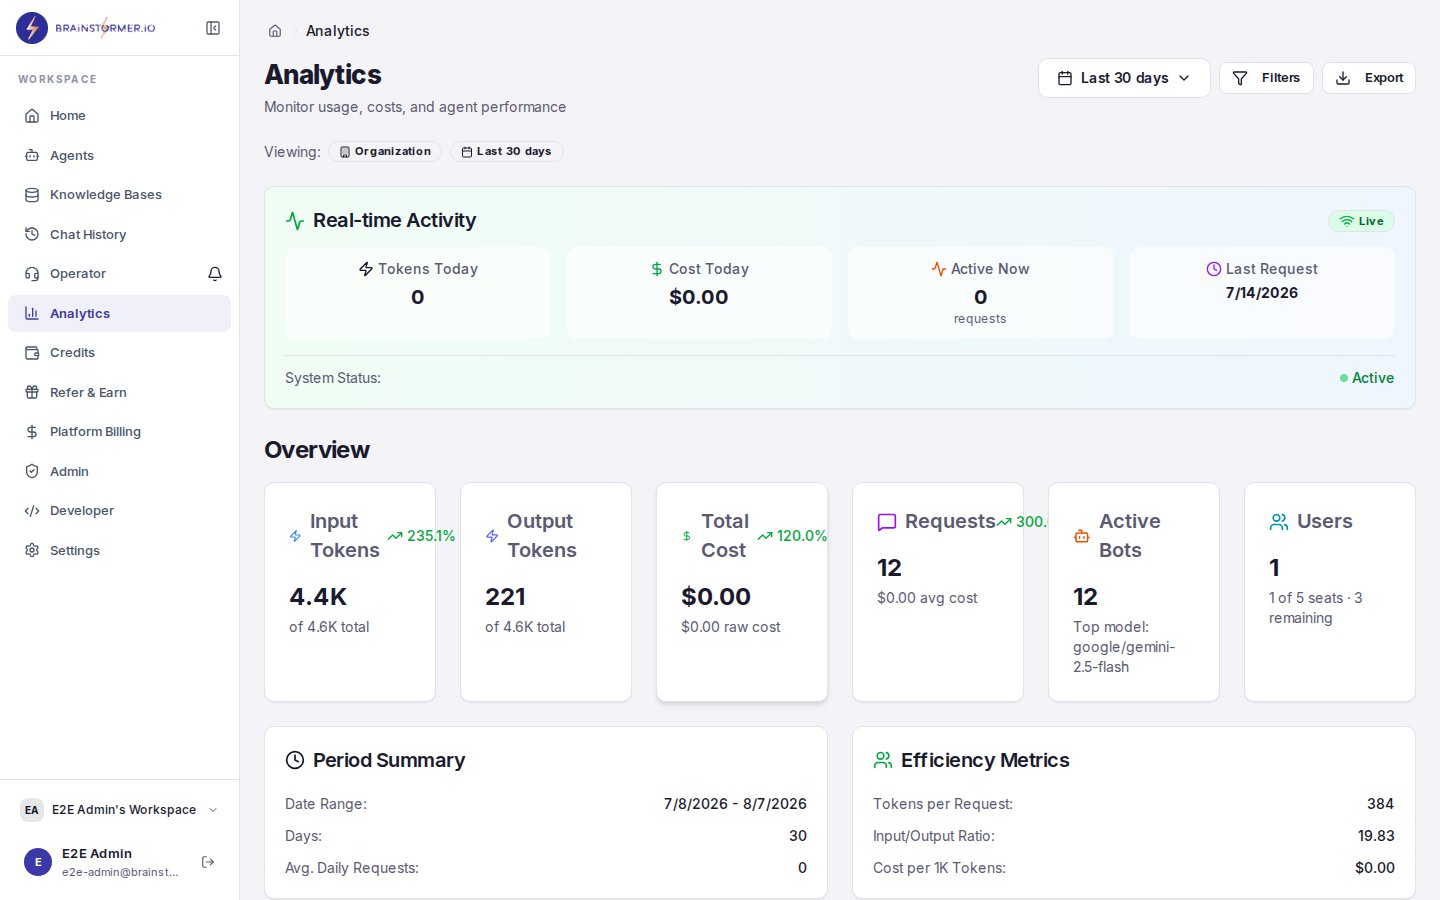
The analytics dashboard showing usage trends and breakdowns
- Credit balance with progress bar showing usage against your plan allocation
- Usage breakdown by operation type (chat, embeddings, vector ops, storage)
- Daily usage trend — See how your usage patterns over time
- Per-agent breakdown — Which agents consume the most credits
Per-Conversation Cost
Each conversation tracks token usage and cost:- Input tokens and output tokens per message
- Cost per message based on the model’s pricing
- Total conversation cost
Credit Ledger
Every credit transaction is recorded in an immutable credit ledger. Each entry includes:- A plain-language description — what the entry was for, e.g. “Monthly plan renewal · Growth plan · 35,000 credits” or “Credit top-up · 10,000 credits” — not a raw internal label.
- Transaction type — Debit (usage) or credit (purchase, refund, plan renewal, admin grant)
- Amount — Credits consumed or added
- Balance before and after — Running balance at the time of transaction
- Reference — Link to the specific operation (chat message, embedding batch, etc.)
- Timestamp — When the transaction occurred
Cost Optimization Tips
Choose cost-effective models
Choose cost-effective models
Model pricing varies dramatically. GPT-3.5 Turbo or Gemini Flash can be
10-50x cheaper than GPT-4 Turbo for simple use cases. Match your model to
the complexity of the task.
Use fixed-mode prompts where possible
Use fixed-mode prompts where possible
Fixed welcome messages and static system prompts do not call the AI model
and cost nothing. Only use generated mode when you genuinely need dynamic,
context-aware content.
Optimize knowledge base content
Optimize knowledge base content
Well-organized, relevant content reduces the number of search queries needed
and improves hit rates. Remove outdated or duplicate content that wastes
embedding and storage credits.
Monitor per-agent usage
Monitor per-agent usage
Some agents may consume far more credits than others. Use the per-agent
breakdown to identify high-cost agents and optimize their model selection or
prompt length.
Superadmin Billing Dashboard
Platform superadmins have access to an additional billing dashboard at Admin > Billing that shows:- Raw cost vs. charged revenue — Platform margin visibility
- Provider breakdown — Costs by provider (OpenRouter, Pinecone, S3, etc.)
- Daily trend — Revenue and cost over time
- Top organizations — Which orgs consume the most
- Plan mix — Distribution of organizations across plans